1. Statistical Analysis in Correlation
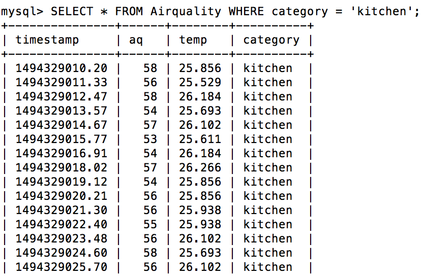
In our analysis model, we got three attributes, air quality, temperature, and dust, that would possibly affect each other in the room. To specifically address this point, we first calculated their correlation in nearly ten thousand data points measured in the reading room, balcony, kitchen, and bathroom.
What is Correlation ?
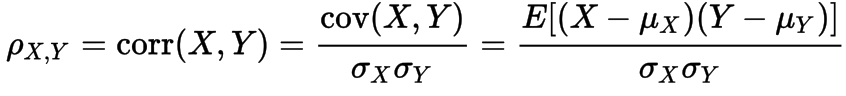
Correlation is any of a broad class of statistical relationships involving dependence, they are useful because they can indicate a predictive relationship that can be exploited in practice.In informal parlance, correlation is synonymous with dependence. The correlation coefficient is defined as a formula below, where Mx is the expected value of random variable X and Lamda X is its standard deviation. (Quote from Wikipedia)
How will Correlation coefficient help us see through ?
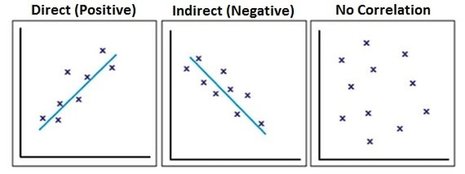
In order to track dependencies of data stored in our MySQL, we exploited statistical module scipy.stats in Python and plugged in two of the three attributes, air quality, temperature, and dust each time for each location(bath room, kitchen, reading room, and outdoors). The range of this coefficient is [-1,1] , and when it gets larger, it means there are more correlation among these two variables. And if it is negative, it indicates when one of the attributes increases, the other one will decrease correspondingly. (The right graph below is quoted from biology for life)
|
|
2. Nearest Centroid Classifier
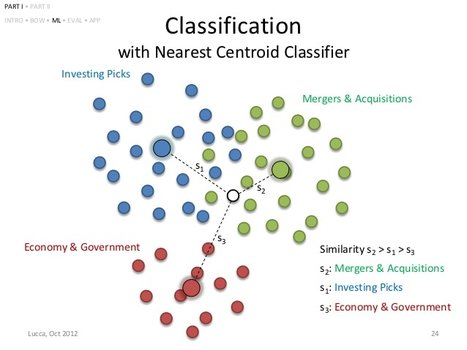
This classifier is an easy to implement machine learning algorithm that represents each class by the centroid of all its data points. When there's a new data point comes in, the model will classify it according to which centroid is nearest to the new data point.
How will Nearest Centroid Classifier help us see through
This machine learning model can be achieved by using sklearn.neighbors.nearest_centroid library in python.
Its very straightforward and intuitive, the closer the testing data point is to the centroid , the more probable it could be belong to that category.
Its very straightforward and intuitive, the closer the testing data point is to the centroid , the more probable it could be belong to that category.
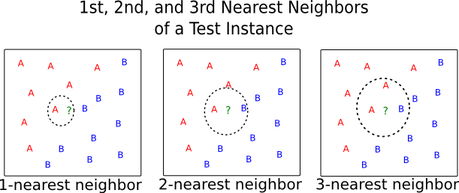
3. K-Nearest neighbors Classifier
In our k-NN classification, the output is a class of category. An new data point coming in is classified by a majority vote of its neighbors, with the point being allocated to a category most common among its k (positive integer) nearest neighbors.
In our training set, there are three vectors (air quality, temperature, dust) in a multidimensional feature space, each is belong to category label (reading room, outdoors, kitchen, and bathroom). As for a good choice of k ,it depends upon the data; generally, larger values of k reduce the effect of noise on the classification, but make boundaries between classes less distinct. Be careful, k can not be multiple of number of categories (Partially quoted from Wikipedia)
In our training set, there are three vectors (air quality, temperature, dust) in a multidimensional feature space, each is belong to category label (reading room, outdoors, kitchen, and bathroom). As for a good choice of k ,it depends upon the data; generally, larger values of k reduce the effect of noise on the classification, but make boundaries between classes less distinct. Be careful, k can not be multiple of number of categories (Partially quoted from Wikipedia)
How will KNN Classifier help us see through
In our analysis, we chose k to be 11, which is not easy to be equally voted by the four categories. As the testing point coming in, the machine learning model starting searching its Kth neighbors; Until k is reach the machine start counting the vote from each category and decide whether the data point is from kitchen, reading room, outdoors or bathroom. The KNN model is kind of different from Nearest centroid model for that KNN uses the new data point as a center to start classifying itself while Nearest Centroid applied the centroid of all the categories to allocate the new data point to one of them. Which one is better, I think KNN is sort of more accurate but it still requires more experiments to endorse that.
